
If you’ve followed me all the way down this experimental rabbit hole, thank you! I hope my calculations provided some data you’ll find helpful, or at least interesting. If you were wishing there may be some sort of summary, so you don’t have to wade through 6 posts to get the particular statistics you found most useful, I’m here to help with that as well. Here is what we’ve learned about what happens in libraries in an economic downturn:
Nationally:
In his study “Impact of a Great Recession on Library Use: Does a Negative Economy Impact Library Use?,” Michael Mabe looked at what happened in libraries looking at usage data from before the Great Recession and during the Great Recession. He found that not only did no library in his sample show a reduction in use, but he found statistically significant evidence that:
- Circulation increased by an average of 13.3%
- Visitors increased by an average of 26.8%
- Usage was not related the funding that a library received
Massachusetts: Libraries Did More…
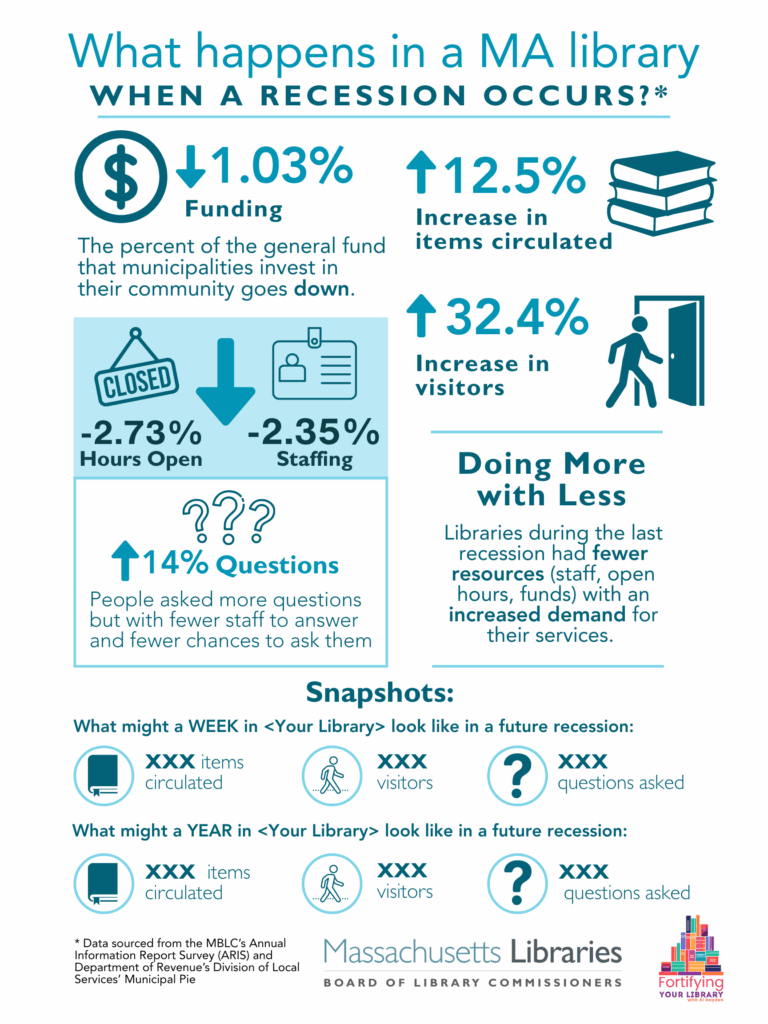
In looking at the same years and starting with the same metrics, I found that Massachusetts libraries’ usage was affected during the Great Recession in the following ways:
- Circulation increased on average by 12.5%
- Visitors increased on average by 32.4%
- Circulation for children’s items increased on average by 13.2%
- Reference transactions increased on average by 14.0%
- Summer reading participation increased on average by 35.6%
- Bookmobiles and branches’ (outlet) circulation increased on average by 27.4%
- Outlets’ visitors increased on average by 52.3%
- Outlets’ reference transactions increased on average by 51.2%
…With Less
I also found that during the Great Recession, Massachusetts libraries had:
- The percent of their general fund that municipalities invested in libraries decreased on average by -1.03%
- Staffing in libraires decreased on average by -2.35%
- The number of hours libraries were open decreased on average by -2.73%
- The number of hours outlets were open decreased on average by -7.10%
I’ve also outlined many of the findings I’ve described in this series in an infographic which you can download and use here:
Your Library’s Story, In Context
I’ve used averages for all MA libraries for 2 reasons:
1) to make the data I used as comparable as possible to the original study and
2) because calculating the numbers for all 351 municipalities is not a project that normal working hours would allow me to take on. But while the numbers for libraries across the state tell a powerful story, when it comes to how you tell your library’s story, it may also be helpful to demonstrate how a future economic downturn may affect your library, specifically in the context of these averages.
To that end, I have also created an editable template of the above infographic and an accompanying spreadsheet that you can use to learn and share more about what a recession may look like for your library. Feel free to use this information and infographic to highlight the most impactful statistics that demonstrate what your library will experience should the statewide percentages hold true in a future economic downturn. Add your library’s logo and branded colors. Then, use it to tell anyone who may advocate for, have control over, and want to learn more about YOUR library and its budget.
Please keep in mind a few things to help ensure that whatever you might put out does not get misconstrued or perceived as disingenuous:
- the percentages that I use to calculate all of the hypothetical extrapolations reflect how libraries changed during the Great Recession
- none of this is designed to predict the future, only to model a potential scenario should we experience an economic downturn; the exact effects are and will remain unknown until we’re able to look back and reflect on what happened
- models and extrapolations are used all the time, in many different fields, as a framework for understanding how a pattern may emerge in potential circumstances; they are not irrefutable in any field, but they can be a powerful way of explaining the potential for a need before that need actually arises
I have before stressed that librarians are professionals and, by extension, the field of library studies is a solid, professional field. We can (and should) use the tools other professionals employ to make their case, to make the case for our libraries.
I hope you find this information and these tools helpful to you in some way. I’ll be poking around some more rabbit holes in the search for more information, policy best practices, and tools that hopefully, you will also consider helpful additional ways to fortify your library.
~ Al Hayden, MBLC Library Advisory Specialist
Leave a Reply